Oracle SOA Suite 11g: a workaround for long running SQL queries
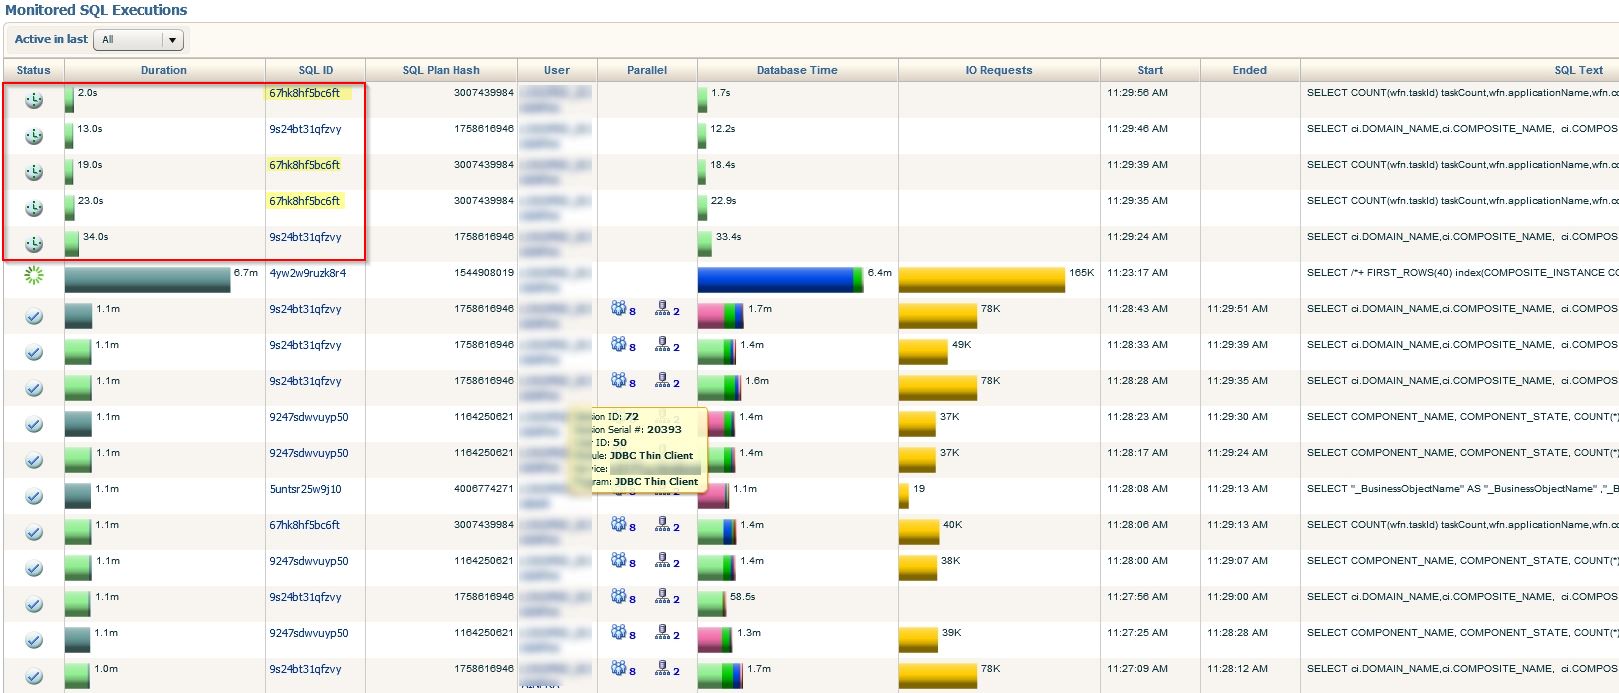
Oracle SOA Suite 11g (11.1.1.7) environment is connected to a database which is its dehydration store database, used to store process status data, especially for asynchronous BPEL processes. Production environments tend to produce millions of records in tables of that database. This, when not well maintained, can become a true performance bottleneck in the database and SOA Suite engine itself. Some of the performance issues can be caused by long running queries being queued in a database. Here is the example. Three SQL queries were executed in a database in parallel, multiple times per minute but it required 1-4 minutes for database in order to resolve each of them. Next to that there were more than 150M of records in CUBE_INSTANCE table, because historical composites’ instances were not being purged properly. The entire environment was monitored by Oracle Enterprise Manager 12c.
Here are the 2 of 3 SQL queries (3rd query has different solution):
SELECT ci.DOMAIN_NAME ,
 ci.COMPOSITE_NAME ,
 ci.COMPOSITE_REVISION,
 ci.COMPONENT_NAME ,
 ci.STATE ,
 COUNT(*)
FROM CUBE_INSTANCE ci
WHERE ci.COMPONENTTYPE = :1
GROUP BY ci.DOMAIN_NAME ,
 ci.COMPOSITE_NAME ,
 ci.COMPOSITE_REVISION,
 ci.COMPONENT_NAME ,
 ci.STATE
ORDER BY ci.DOMAIN_NAME ,
 ci.COMPOSITE_NAME ,
 ci.COMPOSITE_REVISION,
 ci.COMPONENT_NAME ,
 ci.STATE
SELECT COUNT(wfn.taskId) taskCount,
 wfn.applicationName ,
 wfn.compositeName ,
 wfn.compositeVersion ,
 wfn.componentName ,
 COALESCE(wfn.state,'COMPLETED') state
FROM WFTask wfn
WHERE ( ( ( ( wfn.rootTaskId = wfn.taskId )
AND ( wfn.componentType IS NULL
OR wfn.componentType = :1 ) ) )
AND ( wfn.isTemplateTask IS NULL
OR wfn.isTemplateTask <> :2 ) )
GROUP BY wfn.applicationName ,
 wfn.compositeName ,
 wfn.compositeVersion ,
 WFN.COMPONENTNAME ,
 wfn.state
First action was to run SQL Tuning advisor in order to search for better SQL Profiles. This helped a bit, we were able to limit SQL execution time from 4 minutes to 1. But that was still not enough. Queries were queued in a database:
Here is a temporary fix:
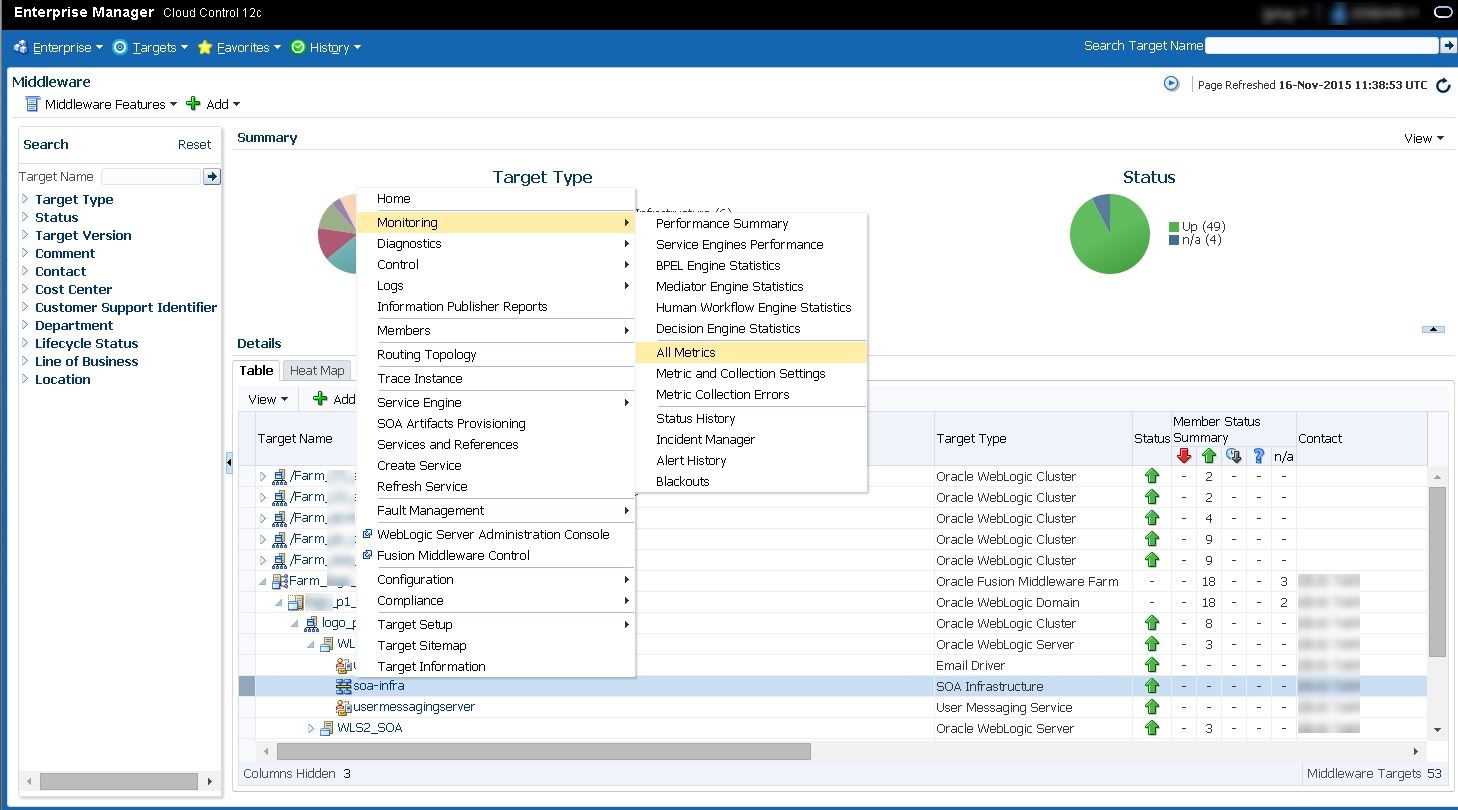
Disable or limit Data Collection frequency of the following monitoring metric in Oracle Enterprise Manager 12c: “SOA Infrastructure – Recoverable Faults”
Go to OEM12c Middleware Targets page and right mouse click on soa-infra, select Monitoring end click ALL Metrics.
Scroll down All Metrics list and select SOA Infrastructure - Recoverable Faults. Click Modify and modify collection schedule.
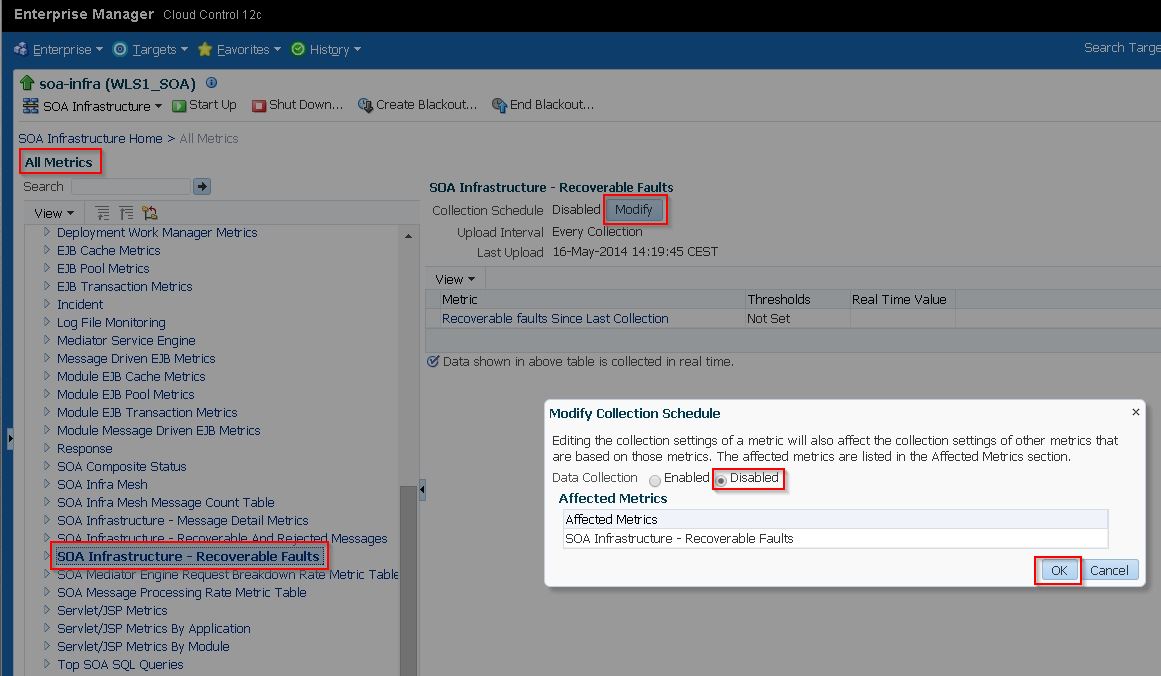
Once disabled the queries are no longer executed in SOA Database.
Here is potential fix for the 3rd query:
SELECT  COMPONENT_NAME ,
        COMPONENT_STATE,
        COUNT(*)
FROM    MEDIATOR_INSTANCE
GROUP BY COMPONENT_NAME,
        COMPONENT_STATE
ORDER BY COMPONENT_NAME,
        COMPONENT_STATE
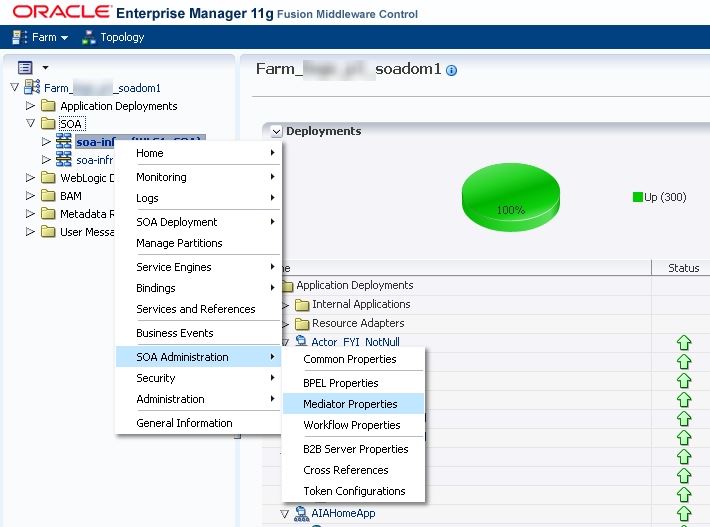
Go to Oracle Enterprise Manager 11g Fusion Middleware Control (not OEM12c)
Expand SOA and right click on soa-infra select SOA Administration > Mediator Properties, set Metric level to Disabled.
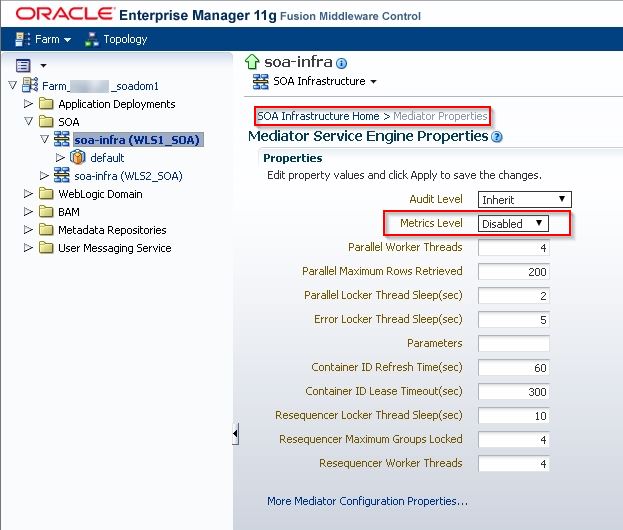
Once disabled, all the three queries were no longer executed in a database.
However this is not a permanent solution. The reason behind this issue is certainly a large number of historical instances in a database causing database processing certain queries much longer than it should be. Next step is to purge/delete unwanted data from the database and implement good purging strategy for SOA Suite environment.
Here are materials about purging large number of instances in SOA Suite 11g environments:
- Oracle White Paper: SOA 11G Database Growth Management Strategy (PDF)
- Oracle Docs: FMW Administrator’s Guide for Oracle SOA Suite and BPM Suite
- An article: Delete large numbers of instances in Oracle SOA Suite 11g
- And another article: Purging SOA Suite 11g, the Extreme Edition
- An SQL Script which will help you count number of rows in SOA_INFRA tables: count_soa-infra_rows.sql
Cheers!!